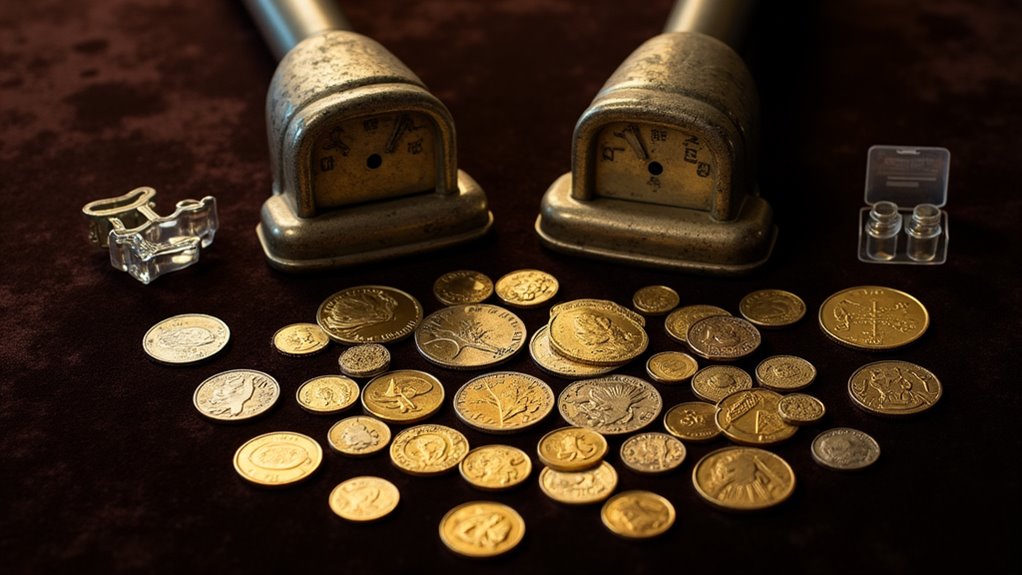
Gold price forecasting’s getting wild! Analysts are tossing around numbers from $2,050 to a jaw-dropping $7,000 per ounce by 2030. The heavy hitters – ARIMA models, LSTM networks, and Random Forests – crunch the data while central banks’ moves keep everyone guessing. Market dynamics, geopolitical drama, and the US dollar’s swagger all stir the pot. But here’s the kicker – black swan events could flip these predictions on their head. The real story’s just beginning to unfold.

The glitter of gold’s future has analysts clutching their crystal balls – and this time, they’re seeing dollar signs that’ll make your head spin. Goldman Sachs is playing it cool with a modest $2,050 per ounce forecast, while other market mavens are throwing around numbers like $3,000 by 2025. Some particularly enthusiastic forecasters are even whispering sweet nothings about $5,000 – talk about getting hearts racing.
The technical wizards are pulling out every trick in their digital arsenal to predict where this precious metal’s headed. ARIMA models crunch time series data like it’s going out of style, while those fancy LSTM neural networks are doing their best impression of a financial fortune teller. Random Forest algorithms are joining the party too, throwing their algorithmic hat into the ring of prophecy. Traditional approaches like the seasonal naive method still serve as crucial baseline predictions for comparison. Central banks’ buying strategies can significantly sway gold prices, making them a key player in market predictions. Additionally, the sustainable practices in gold mining can influence long-term supply and, consequently, market prices.
But let’s get real – predicting gold prices is about as easy as nailing jello to a wall. The market’s got more mood swings than a teenager, influenced by everything from central bank drama to geopolitical temper tantrums. The US dollar strength has historically shown an inverse relationship with gold prices, making currency markets a crucial factor to watch. Inflation rates and currency fluctuations keep throwing curve balls, while supply-demand dynamics play their own unpredictable game of economic chess. Moreover, fundamental factors driving gold prices such as changes in interest rates can create significant volatility in the market. Historically, gold has been viewed as a hedge against inflation, making its performance during economic uncertainty a key consideration for investors.

Looking further down the road (way down, like 2030-2050), some analysts are getting downright wild with their predictions. Seven grand per ounce by 2030? Sure, why not! The long-term crystal ball gets pretty foggy though, considering how the whole safe-haven asset landscape might flip on its head by then. Market pros are hedging their bets faster than you can say “economic uncertainty.”
The technical analysis crowd’s got their own bag of tricks – moving averages, RSI indicators, and those beloved Bollinger Bands that look like squiggly spaghetti on charts. They’re all trying to make sense of the chaos, drawing lines and patterns like modern-day financial artists. Sometimes they even get it right (broken clock, twice a day, you know the drill).
Here’s the kicker though – all these predictions matter big time. Investment bigwigs use em’ to make multi-million dollar decisions, while central banks and governments base serious policy choices on where they think gold’s headed. Even the jewelry makers and electronics manufacturers are keeping their eyes peeled, cause nobody wants to be caught with their gold pants down when prices go nuts.
The real challenge? Trying to factor in those pesky “black swan” events that nobody sees coming. How do you quantify the impact of a global crisis that hasn’t happened yet? Or measure the weight of a tweet that could send markets into a tizzy? It’s enough to make even the most seasoned forecaster reach for the aspirin bottle.
Frequently Asked Questions
How Do Geopolitical Tensions Specifically Affect Gold Prices in Different World Regions?
Geopolitical tensions spark wildly different gold reactions across regions – it’s a circus out there!

Middle East conflicts send Western investors scrambling for safe havens, while Asian markets typically show more restraint.
European gold demand spikes with ECB policy shifts and regional instability.
Latin American political drama? That’s driving Brazil’n Venezuela’s neighbors straight to the bullion shops!
Meanwhile, US-China trade spats keep everyone’s metal detectors beeping.

Who’d’ve thought geography could make gold dance so differently?!
What Role Do Central Bank Gold Reserves Play in Price Fluctuations?
Central banks wield massive influence over gold prices through their strategic reserve management.
Their 20% collective holdings of all mined gold means every purchase or sale sends ripples through markets. When they buy big – like 2022’s whopping 1,082-tonne shopping spree – prices typically surge.
But it’s not just the buying that matters; even whispers of central bank intentions can trigger market jitters. Their moves signal confidence (or lack thereof) in gold’s monetary role.
How Do Seasonal Patterns Influence Gold Trading and Investment Strategies?
Gold’s seasonal dance is a predictable tango – and savvy traders know the steps.

July kicks off the upswing, with prices typically surging 6.96% through February’s peak. Indian wedding season and Chinese New Year drive demand like clockwork, while January’s historically the hottest month (literally crushing it 70-80% of the time).
But watch out for September – that month’s a real party pooper, dragging prices down with shocking consistency over recent decades.
Can Cryptocurrency Market Trends Impact Gold Prices in Today’s Economy?
Cryptocurrency markets increasingly influence gold prices through interlinked investor sentiment and capital flows.
When Bitcoin plunged 28% in early 2025, gold surged 11% – a classic flight to safety.

The introduction of Bitcoin ETFs has amplified this relationship, creating a fascinating dance between digital and physical assets.
Institutional money now flows freely between both, while tokenized gold products ($1.8B market cap) blur the traditional boundaries.
Talk about market evolution!
What Effect Do Mining Production Costs Have on Long-Term Gold Values?
Mining production costs create a vital price floor for gold, acting as a fundamental support level.

When costs hit $1,276/oz in 2022, they effectively set a minimum threshold that keeps values from crashing. Higher extraction expenses, driven by energy prices and labor shortages, force miners to demand better prices – or shut down operations.
This cost-driven dynamic helps explain why gold typically trades 45-60% above production costs, establishing a reliable base for long-term valuations.